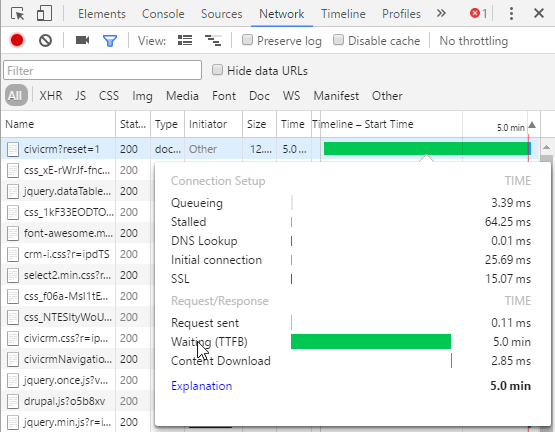
There are several things happening on the dashboard, so you'll need to dig further into this yourself to find the real underlying issue. Here are some things which could trigger symptoms like what you're describing.
Database warmup
This is the most common cause of slow dashboards IMO, but it's dependent on your setup; see note re Timeouts below.
Your DB engine keeps frequently used data in memory. When CiviCRM isn't being actively used overnight, that information will be replaced in memory by other data, and will be read from disk. This is slower. (Nightly DB backups frequently push active daily data from memory, as does a changed traffic profile when your staff knock off.)
We have a testing server which hosts multiple WIP databases. It mirrors your description; starting work on Site A will incur a few seconds (or longer) "warm-up" time. This suggests that the server is overloaded (for production use!).
A workaround is to log into the site earlier, before your morning call / coffee brew / whatever. If we know we're working on example.com and example.org today, we can drush uli and visit /civicrm on both sites before we kick off for the day. Moving a delay can make it disappear :)
The ideal solution is to make more memory available to MySQL. Buying memory is probably cheaper than the (admin, staffing) cost of dealing with insufficient memory. :)
Timeouts
If reproducible, a specific five minute time as seen in your screenshot suggests you're hitting a timeout. This is compatible with the next answer, provided that you have a slow dashboard report which takes more than five minutes, so you reliably hit that timeout.
- You request the CiviCRM dashboard
- CiviCRM internally requests a report
- Report spins its wheels for (at least) five minutes
- CiviCRM stops waiting and serves you the dashboard minus that report.
Observing a predictable delay (=timeout) then a successful response from the server (as opposed to a predictable delay followed by error message from server, or a predictable delay then error message from the browser) indicates that the timeout is happening internally to CiviCRM.
A five minute timeout could be configured at different layers, in your webserver (eg PHP max_execution_time, apache TimeOut) or in CiviCRM codebase (eg cURL's CURLOPT_TIMEOUT). You don't really want to change the timeout, you want to speed up that process so it doesn't hit the timeout!
Dashboard reports
The dashboard is user-customisable, so the reports you choose to show there will affect the time it takes to display. Because the dashboard contents are delivered as a single page to the admin, you can't see which report is fast or slow. Disabling some reports, or observing the internal requests made from CiviCRM (by watching your weblogs) might allow you to see which reports add the load time to the dashboard.
To identify these dashboard report loads in the webserver logs, look for POST requests to /civicrm/ajax/dashboard immediately before your GET request for /civicrm/dashboard?reset=1 is completed. Timing on those requests will indicate if they are the delay factor.
Check MySQL activity too - I use mytop, which is just MySQL's SHOW FULL PROCESSLIST as a command. If you see long-running queries generating reports, you can balance whether to improve the report, remove it from your dashboard, or accept that it's worth the wait.
Reports using memberships / smart groups
If dashboard reports include smart groups or memberships, remember that memberships get updated daily (by cron), and that smart group caching is only for a limited time. Such reports would need to be regenerated the first time they are run after midnight. CiviCRM includes functionality to schedule report generation, so you could keep your contact DB warmed up (or on the boil!) by scheduling a report to display before you start work, or perhaps by embedding the same dashboard reports on a public screen in your office :)
URL / webserver configuration
CiviCRM makes internal requests while delivering the dashboard as well. Slow performance here could be indicative of a misconfiguration, eg:
- CiviCRM is unable to communicate with the local site
- CiviCRM is unable to communicate with CiviCRM.org infrastructure
- DNS on the webserver is slow or incorrectly configured
Issues with these should trigger warnings on the admin screen which you would likely have mentioned, but it's worth checking that too. These warnings can be disabled, which might work to hide the symptoms.
Requests to CiviCRM.org
As above - CiviCRM communicates with CiviCRM.org while loading the dashboard. This functionality can be disabled (can't it?), but if doing so was working but slow or slow to return an error, you'd see a delay in rendering the dashboard also.
